Visitor Locations

Wednesday 31 August 2011

Hurricanes

Bringing geographical news stories alive in the classroom is an exciting aspect of teaching geography as it reaffirms its importance in society and needless to say its relevance in secondary education. By raising awareness of current affairs, young geographers are encouraged to learn about world issues and events. The devastation caused by Hurricane Irene has been reported in recent news stories, however, the media often avoid revealing the science behind such natural phenomena. Therefore, the aim of this blog is to gain a better understanding of how hurricanes form before investigating the effects of Hurricane Irene.


What are hurricanes?


A hurricane is the American classification for a ‘tropical cyclone’. These a referred to differently, depending on where in the world they arise – Typhoons in the South Asian Pacific, Cyclone in the Indian Ocean and the Willy Willies in Australia.

Tropical cyclones are born from low-pressure systems emerging over tropical or sub-tropical waters where organised convection (thunderstorm activity) and surface winds circulate.

This map published by 'The Rough Guide to Weather' (Robert Henson, 2007),
identifies the major zones where tropical cyclones develop and the typical
direction in which they travel.

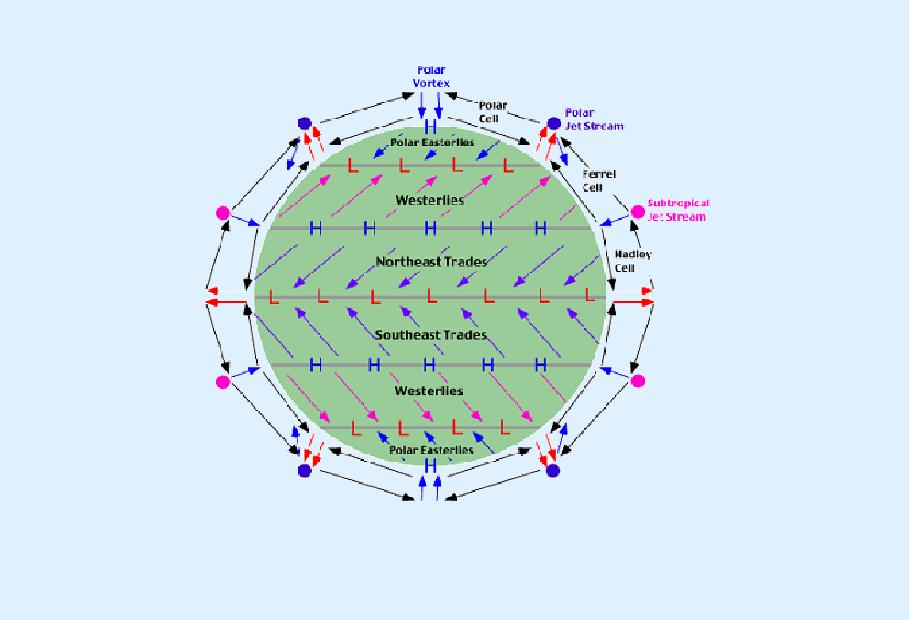
An aerial view of a hurricane


Why do they form?

> Key atmospheric and oceanic conditions are the catalyst for their formation.
At the tropics there is a vast area of low pressure reaching north and south of the equator called the Inter-tropical Convergence Zone (ITCZ). North-east trade winds flow in the northern hemisphere tropics and south-east trade winds flow in the southern hemisphere. These winds facilitate the transfer of energy within parcels of convection currents (air that has been heated) causing thunderstorms. When thunderstorms cluster together, a flow of substantially warm, moist, rapidly rising air leads to the development of a nucleus of low pressure, or depression, at the surface.
Coriolis force is at its strongest at the tropics the rotation the column of rising air is easily initiated. When winds reach 74 m.p.h the tropical storm is re-categorised as a hurricane. The helical winds accelerate inwards and upwards, releasing energy and moisture in the process.

Main factors influencing hurricane development:

  1. Warm surface waters exceeding 26 °c between August and October to supply sufficient latent heat energy from condensation (average of 60% humidity levels)
  2. Convergence of surface winds causing air to rise and clouds to collide.
  3. Low wind shear (conformity of wind speed with height) to enable clouds to ascend vertically.
  4. Sufficient Coriolis force to create spin.


The structure of a hurricane:

·        In their infancy they are known as ‘tropical depression’ – this is when they are at their weakest. As they intensify it becomes a tropical storm, then a hurricane/typhoon.
·        At the core, a small area of horizontal surface winds can travel in excess of 100 m.p.h.
·        Above this huge cumulonimbus clouds extend high into the sky like great towers of spiralling air.
·        6 miles above the surface the clouds merge into a thick blanket and change direction – moving away from the nucleus or ‘eye’ of the storm.
·        Air descends at the eye of the storm – this is characteristically a funnel of dry, cloudless air.


> Once hurricanes travel over land they dissipate (die) for they loose their source of moisture.

Sunday 28 August 2011

Resources for Key Stage 3

Personally I find A level geography more interesting to teach as it covers the more intellectually challenging aspects of the subject. Therefore, this blog is designed to fill the gap in my Key Stage 3 lesson ideas and resources.


Above is a snap shot of the Royal Geographical Society Indian monsoon animation aimed at Key Stage 3 geographers. It is an easy to follow sequence of weather events with annotations in the speech bubble that could be used to commentate on the events as they unfold. Click on the link to access:


This interactive climate system model can be deconstructed by selecting the buttons within the tool bar – for instance, the pressure button flags up the high and low pressure bands, allowing pupils to observe where in the world these prevail. This is an effective way of highlighting global climate features one at a time to avoid information overload. The ‘read info’ tool describes the principle actions in a clear and concise way.

http://www.geographyteachingtoday.org.uk/images/activities/climate_system.html


It is also important to cover the Thermohaline Circulation, commonly known as the ‘Global Heat Conveyor’, for it is a critical component of the climate system. This will be analysed in greater depth in a future blog.


Radical Geography contains a broad range of activities to download Key Stage 3 climate and weather; from end of topic tests for year nine (pictured below) to homework tasks and fun games such as weather noughts and crosses. This site proves there is great scope for cross-curricular study, by combining geography with ICT, music and mathematics.


Metlink also has lesson activities that incorporate mathematics, for example the global temperature data analysis task gives instructions for obtaining temperature data and discovering why differences exist. The second activity requires pupils to practice their creative writing skills by imagining they are a travel writer to produce a weather report for three British tourist destinations.


Wednesday 24 August 2011

Case Study: The Pakistan Floods of 2010


Unprecedented levels of monsoon rainfall led to the catastrophic floods in Pakistan’s Indus River basin in July 2010 - the nations worst flood since 1929. An area the size of England was affected.

An informative collection of maps and hydrographs.
Class task - interpret the storm hydrographs.


The Geography of Pakistan


  • Pakistan is situated in the northwest of the South Asian subcontinent.
  • The country can be divided into three main geographical areas; the Indus river plain; the two provinces of Punjab and Sindh, and the Balochistan Plateau.
  • Home to the famous K2 (Mount Godwin), the second highest peak in the world.
  • The climate is generally arid though it is influenced by the south east Asian monsoon. Half of the annual rainfall occurs in July and August, averaging about 255 millimeters in each of those two months.
  • Gained independence from the British India colony in 1947.
  • Earthquake prone zone along the Himilayan convergence fault line.
  • Provinces of Gilgit-Baltistan, Khyber Pakhtunkhwa, Punjab and Sindh, and the Azad Jammu and Kashmir were all affected by the floods.
Causes

A monsoon depression (low pressure system) formed over the Bay of Bengal, crossed India and reached Pakistan by the 27th July 2010. The rainfall intensified over the subsequent two days as another low-pressure system from the west converged with the monsoon depression, enhancing rainfall. Over 203 mm (8 inches) of rain fell in only three days in the northwest of Pakistan creating a flash flood.
 
Other potential anthropogenic causes such as enhanced climate change, dams and deforestation must be taken into consideration. Sarhad Awami Forestry Ittehad (SAFI), an organisation state that illegal deforestation took place 2007-2009 under Taliban control. According to reports the Tarbela dam became blocked by illegally felled timber, reducing its storage capacity and heightening the severity of the floods. 


Environmental Impacts
  • 23 % of crops were destroyed.
  • Enormous mudslides took place on steep slopes in mountainous areas.
  • Reviving mangroves - replenishment of water and nutrients to natural mangroves that were previously diminishing since the construction of the Tarbela dam on the Indus. 170,000 hectares of mangroves had been lost in the Indus delta of the last 50 years, partially due to poor management of water flow along the Indus, starving the delta of sediments and allowing saline seawater to infiltrate the delta.
  • 20% of tree plantations created in the 2009 – 2010 afforestation project were ruined - leaving hill slopes susceptible to erosion, reducing interception of rainfall and increasing the intensity of future floods.
  • Loss of breeding grounds - the floods washed away vital wetland breeding grounds for wading birds and fish.
  • Habitat loss - an estimated 80% of reptile and small mammal habitats were affected within the Swat and Panjorka river catchments.
  • Pollution - a 62000 litres of petroleum and 44300 litres diesel from pumps.

Mass subsidence in the highlands


Human Impacts

  • 1781 fatalities.
  • 2966 people injured.
  • 20 million people affected in over 11000 villages.
  • £1.5 billion agriculture loss.
  • 1.9 million houses damaged.
  • Entire villages were submerged resulting in more than a million people displaced from their homes.
  • Spread of disease epidemics.
  • Infrastructure was demolished. Temporary structures such as rope bridges were constructed in the aftermath. 
  • Crops were ruined, some livestock drowned and food reserves were spoiled, creating food shortages that manifested to hunger and malnutrition. Food aid was donated from the UN.
  • Livelihoods dependent upon timber extraction, agriculture, fisheries and infrastructure collapsed.


    An adaptable case study

    This case study can be applicable to other major topics within the curriculum such as flooding, climate change and natural hazards.

    Recommended Resources

    The following film report by the Guardian can be used to provide a balanced overview of the positive and negative impacts of the floods:

    The findings of as investigation carried out by the Pakistan Wetlands Trust was documented in August 2010. This is a recommended resource for teachers wanting to do background reading in order to compile a case study for A Level Geographers. 


      Friday 19 August 2011

      Monsoons

      • The term Monsoon derives from the Arabic word ‘Mausin’, meaning ‘the season of the winds’
      • Areas dominated by the north-east and south–east trade winds experience a distinctly wet rainy season and an exceptionally dry season. Regions within South Asia, the Gulf states of North America, the Pacific coast of central America, and Africa encounter monsoons. Asia has the most intense monsoon climate.

      The South East Asian Monsoon

      The monsoon displaces masses of energy to the north and south between 23 degrees latitude and 35 degrees latitude of the eqator, within the Tropics. The different heat capacity characteristics of continents and oceans determine the circulation pathways of the monsoon. 

      In summer, the winds usually flow from the sea to the land causing heavy rains inland. In winter, the winds reverse and flow from the continent to the sea culminating in dry conditions.


      Follow this link below to activate the simulation model of migration of the monsoon season in Asia and Australia provided by the National Weather Service Climate Prediction Centre. It could be an effective, thought provoking lesson starter. The simulation could be left running to show the variations in precipitation, wind direction and wind speed throughout the summer and winter monsoon seasons. This will grab the students’ attention and they could guess the theme of the lesson.


      Metlink provides resources for teaching weather and climate in schools which mirror the national curriculum requirements and has quick links to key specifications:


      Causes:

      Pressure and wind – the land heats up and cools down disproportionately to the sea (oceans warm and cool more slowly than land), this inequality leads to the creation of pressure gradients and thus winds.

      ITCZ (Intertropical Convergence Zone) – the seasonal migration of the ITCZ and it’s wind belts as it moves north and south. This movement is in response to seasonal differences in pressure gradient due to the changes in solar energy received throughout the year.

      Mountain Chains – the presence of huge mountain chains such as the Himalayas results in orographic enhancement of rainfall because air masses are forced to rise and condense. They also can increase low-level convergence of air, creating zone of rising air when moisture laden clouds collide forcing water droplets to grow and fall. Therefore, mountain chains can induce exceptionally high rainfall in convergence zones, eg. Assam in northern India can receive greater than 10,000 mm of rain annually, 6 times that which falls on the coastal regions.


      Jet Stream locality - During the winter, the winds flow north-easterly (the subtropical jet stream divides and follows two pathways, one stronger belt protrudes southwards and one weaker belt flows north of the Tibetan Plateau). High pressure systems develop, air descends beneath the jet and away from the continent seawards. Upper air flow reverses in the summer when the subtropical jet retreats north of the Tibetan Plateau and the Equatorial jet diverts north and flows over the Indian subcontinent in the opposite direction.

      Concentrations of Carbon Dioxide - The concentration of carbon dioxide in the atmosphere over India due to the effect of uplift over the Himalayas means that less heat is absorbed and cooling takes place.
      Facts and Figures:

      Summer monsoon occurs from June to September
      90% of western and central India’s total annual rainfall is received during the summer.
      Average monthly rainfall totals 200 – 300mm
      Winter monsoon occurs from October to May


      Wednesday 17 August 2011

      Global Atmospheric Circulation Patterns

      Variations in air characteristics are wide spread. However, a significant pattern exist on a global scale as air rises and sinks at different laitudes and is also influenced by jet streams and trade winds which force it to shift eastwards or westwards. The basic circulation of the atmosphere consists of a three-cell structure in each hemisphere which is controlled by pressure gradient force. The easiest way to imagine these patterns is by analysing the global circulation model.


      A short film is good way to reinforce learning of the global circulation model. The following film link could be used at GCSE and A Level.


      Alternatively this film clip created by the BBC is available:


      The BBC have a sizable archive of educational ‘Classic Clips’ accessible on the Learning Zone – the quality of production is obviously superior to many of the youtube films made by amateurs. 

      Having observed how film clips are shown within the classroom, a valuable way of ensuring all abilities benefit short clips are often played a number of times. This allows pupils to concentrate on watching it completely the first time, absorbing the information, which they are then encouraged to interpret and query it themselves by answering questions directed by the teacher. Following this the film is replayed and paused intermittently if necessary, to enable each pupil to make notes and draw diagrams.  

      Rossby Waves


      Superimposed onto these global circulation patterns are flows that are determined by the Earth’s rotation, adding to the complexity of the system. At middle latitudes, high above the closed cyclonic and anticyclonic weather systems, smooth wave-like patterns prevail, known as Rossby waves. Temperature contrasts at the polar front where warm tropical air converges cause pressure gradients to emerge in the upper troposphere, producing strong westerly winds that follow the meandering path of the Rosgy waves. Between 5 and 8 upper Rossby waves circle the poles (more develop in the summer).

      Rossby waves play an important role in the formation and evolution of surface weather conditions. Mid-latitudinal frontal depressions (high pressure systems) usually develop downwind of upper troughs, whereas anticyclones (low pressure systems) form downwind of upper ridges of Rossby waves. This is illustrated in the schematic diagram below:


      Jet Streams


      Embedded within these upper westerly winds are narrow currents of rapidly moving air (150-200 KM per hour) called Jet Streams. This is enhanced by the power of the Coriolis force, mentioned in blog 2. Jet streams are typically thousands of kilometres long, hundreds of kilometres wide and numerous kilometres in depth. The relationship between Jet Streams and smaller scale climate responses will be further explored in the next blog that will focus on monsoons.

      This topic features on the AQA A Level syllabus. Weather does not appear in other exam board A Level syllabuses, however, climate change understandably is a compulsory topic for all Geography schemes of work.


      Thursday 11 August 2011

      Lapse Rates

      • Adiabatic (vertical) movement of air caused by uneven land relief or differences in surface temperature contribute to localised weather conditions.
      • Moisture content of air is a key factor affecting its rate of temperature decrease as it ascends. The nature and stability of an air mass/parcel of ascending air is determined by the relationship between three lapse rates of air outlined below:

       
      Environmental Lapse Rate (ELR) = rate of air temperature decrease with altitude.
       
      Dry Adiabatic Lapse Rate (DALR) = rate of cooling of dry air.

      Saturated Adiabatic Lapse Rate (SALR) = rate of cooling of saturated air.

       
      When rising air reaches condensation level it becomes saturated, a process that involves the release of latent heat that in turn retards the speed of temperature decrease as the air continues to rise. It depends on the airs carrying capacity of water vapour (greater at warmer temperatures e.g humid tropics). Therefore, latent heat energy release reduces with height as less water vapour condenses.

      The relationship between the ELR, DALR and SALR influence the temperature and subsequently the density and buoyancy of an air mass.
      The graph below presents the different changes in air temperature lapse rates for dry and saturated parcels of air compared to the environmental lapse rate.


      This graph is available at: http://www.revisionworld.co.uk/node/7805


      This simplified diagram is potentially useful for A Level Geography. More in-depth information about the stability of air along with this diagram is available at:
      Comparing the properties of two different air masses


      Wednesday 10 August 2011

      Characteristics of Moisture in the Atmosphere

      • Temperature determines the state of energy held in water as the atmosphere transports it.
      • Air is at its highest energy state as vapour.
      • The quantity of water within air varies temporally and spatially depending upon availability and temperature.
      • When air reaches its maximum carrying capacity of water it is saturated.
      • Relative humidity is a measure of the amount of water vapour within air as a percentage of the maximum amount it can support if it were saturated at that specific temperature.
      Formation of Clouds:


      Coalescence Theory:

      Water droplets become larger in turbulent air as they collide and merge to form large droplets which eventually fall as precipitation.


      Causes of Air Rising and Cooling:


      Wednesday 3 August 2011

      Heat Transportation in the Atmosphere


      • Without the Sun’s presence, weather would not exist as it is the main source of energy.
      • Global variations in solar radiation receipt lead to a constant imbalance of energy.

      Factors affecting radiation receipt:
      • Latitudinal variations. This energy is redistributed from areas of high solar radiation receipt at the equatorial and tropics, to areas of low solar radiation receipt near the poles – as it strives to reach a global equilibrium.


      • Diurnal (daily) variations exist i.e maximum receipt at midday when the Sun is at its greatest angle.
      • Temporal (time dependent) variations exist due to the altering tilt of the Earth’s axis.
      How does wind form?
        1. Inequalities in solar radiation over the Earth’s surface causes differences in air pressure, hence movement of energy as hot air rises and displaces cold air.  
        2. The Earth’s rotation influences its direction by the Coriolis force – the deflection of motion to the right in the northern hemisphere and to the left in the southern hemisphere.
        3. Friction the Earth’s surface roughness including the presence of mountain belts, sand dunes, tower blocks etc, perturbs air flow causing it to converge into a low which rises above the obstruction or to diverge away into a high.
      Properties of the atmosphere


      Recommended website:
      http://www.geol.umd.edu/~jmerck/geol100/lectures/33.html  (Excellent diagrams and RS images displaying atmospheric stratification and global convection cells).